How to use the spectrum analyzer
- Choose a source. Start microphone analyzes the sound around you. Tab or screen audio analyzes music or video playing in another tab, digitally and with no microphone (desktop Chrome and Edge). Audio file plays and analyzes any MP3, WAV, M4A, OGG or FLAC on your device.
- Read the peak. The loudest frequency is shown above the graphs, with the nearest musical note and how many cents it is off.
- Point at anything. Hover or tap the spectrum to read the exact frequency and level at that point. On the spectrogram, it reads the frequency at that height.
- Freeze to hold the current picture so you can study it, and choose a larger FFT size when you need finer frequency detail.
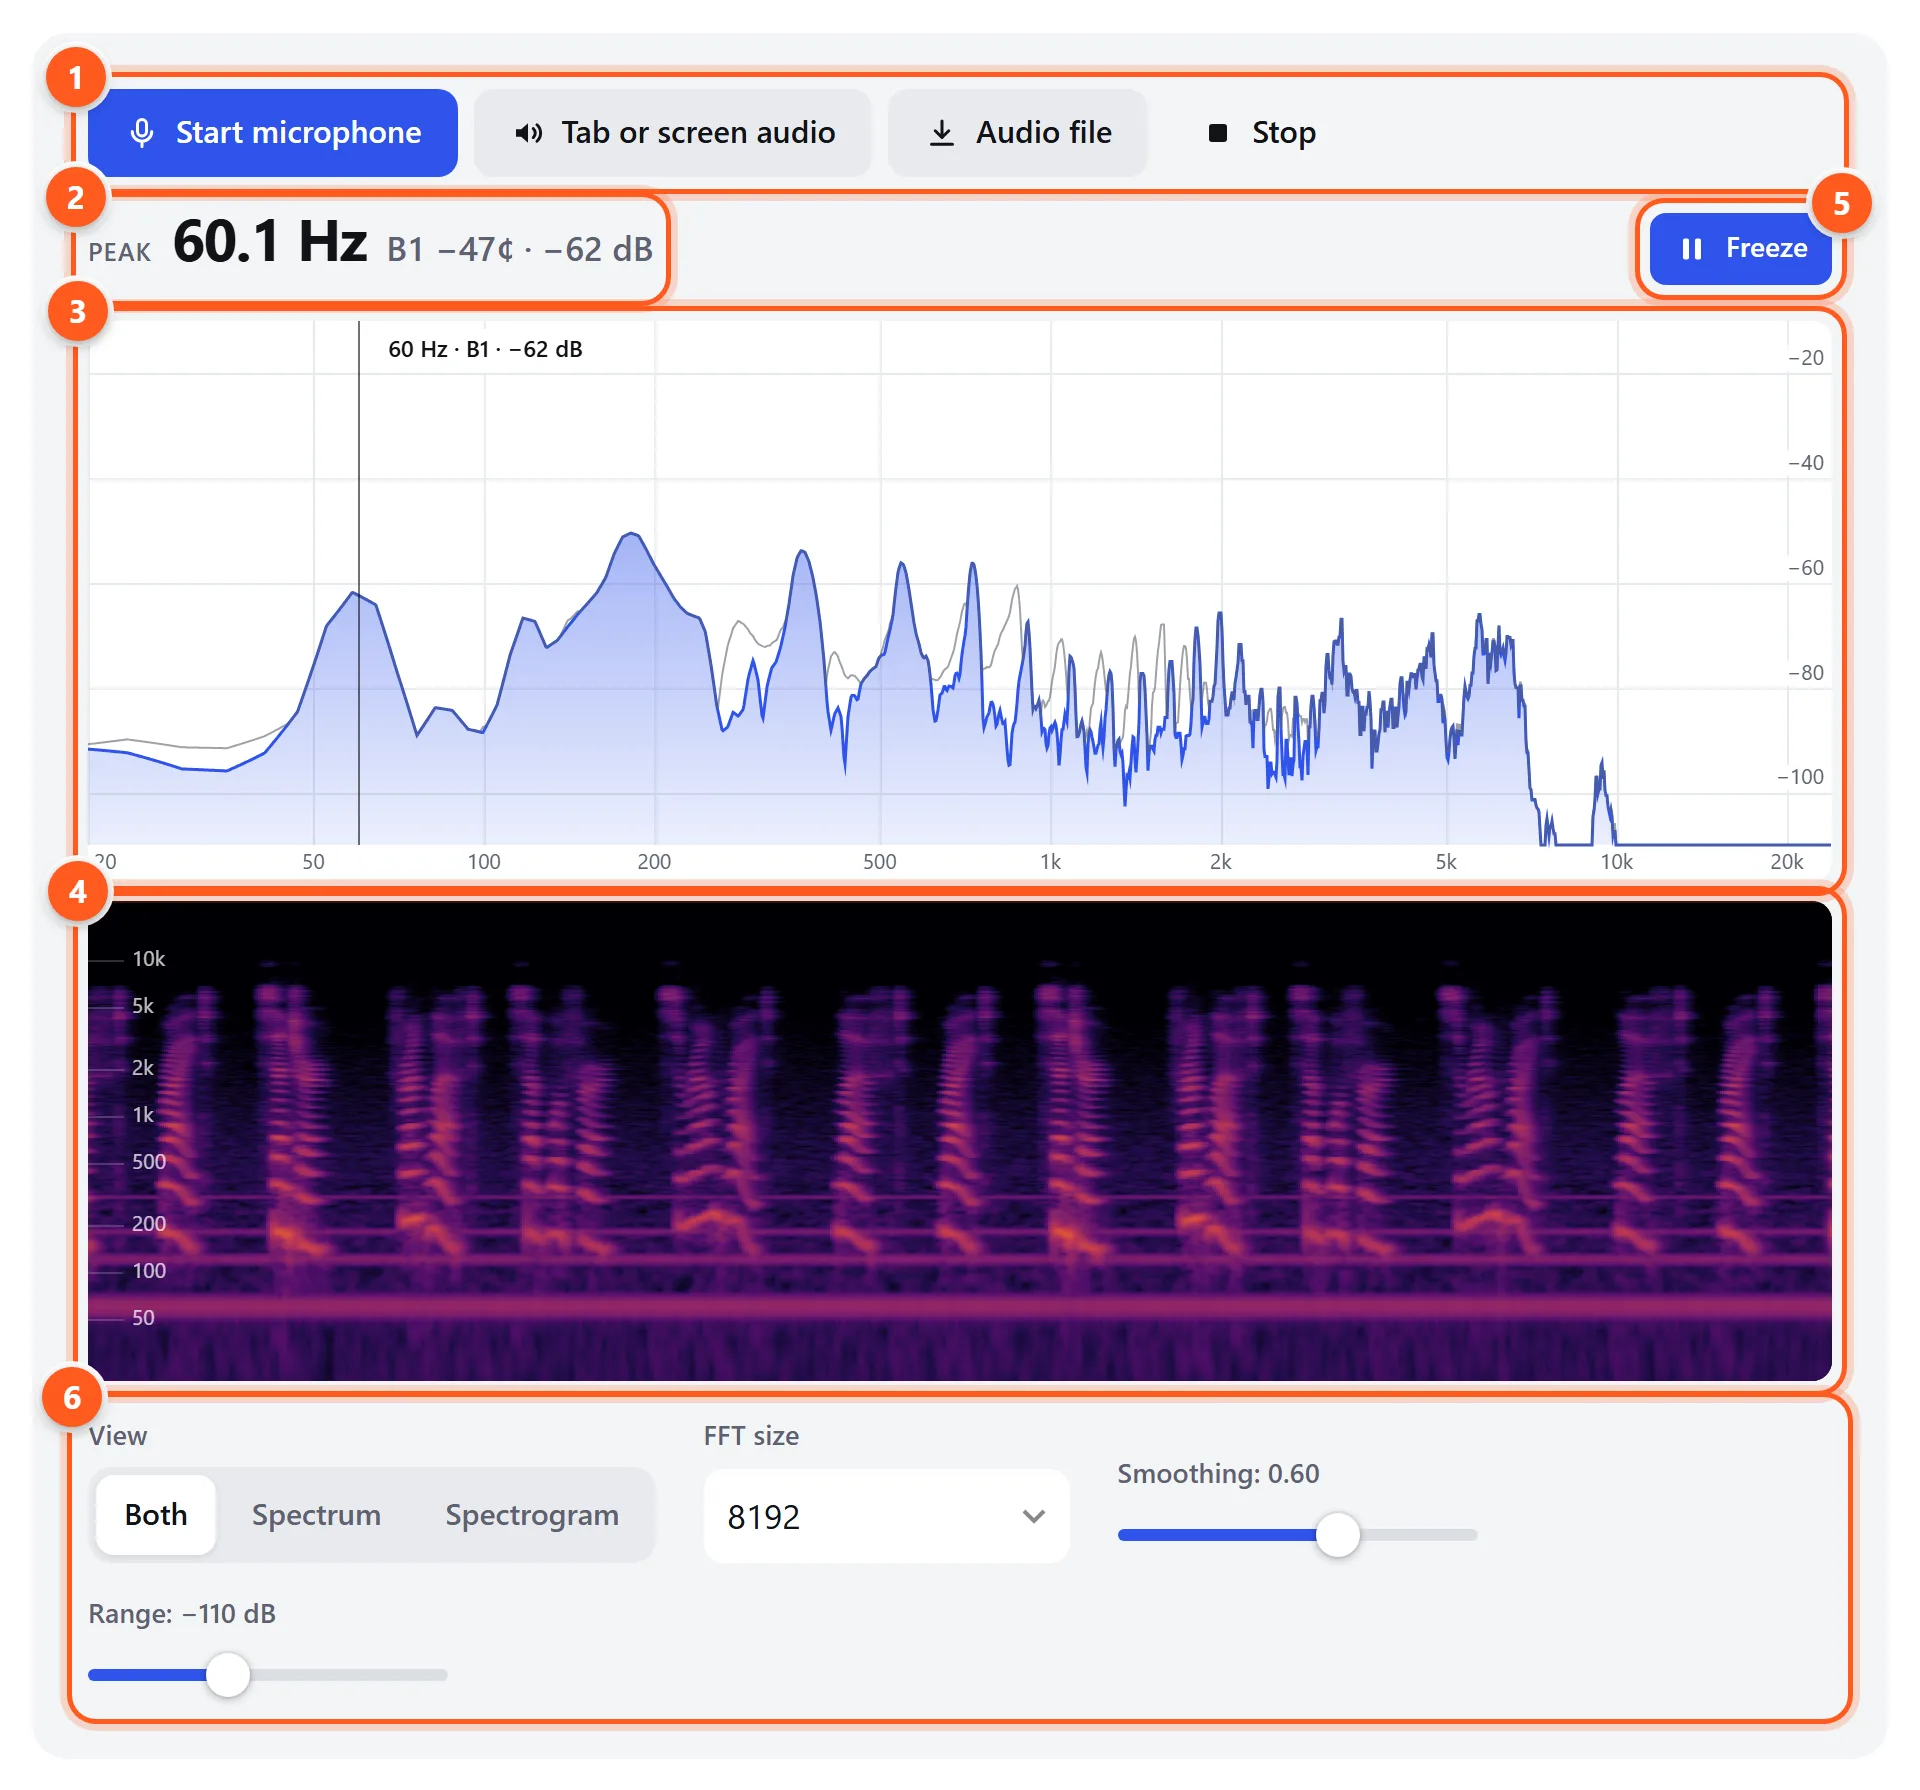
- Pick the audio source: microphone, a browser tab, or a file.
- The strongest frequency right now, its musical note, and its level.
- Spectrum: frequency from 20 Hz to 20 kHz on a log scale, level in dB. The thin gray line holds recent peaks. Hover to read any point.
- Spectrogram: time scrolls left, frequency rises upward, and brighter means louder. The steady horizontal lines here are 60 Hz hum and its harmonics. The vertical blobs are words.
- Freeze the display to study it.
- View, FFT size (frequency detail), smoothing and the bottom of the level range.
How to read a spectrum
The horizontal axis is frequency, from deep bass on the left (20 Hz) to the highest treble on the right (20 kHz). It’s logarithmic, like a piano keyboard: each octave takes up the same width. The vertical axis is level in decibels, and higher means louder.
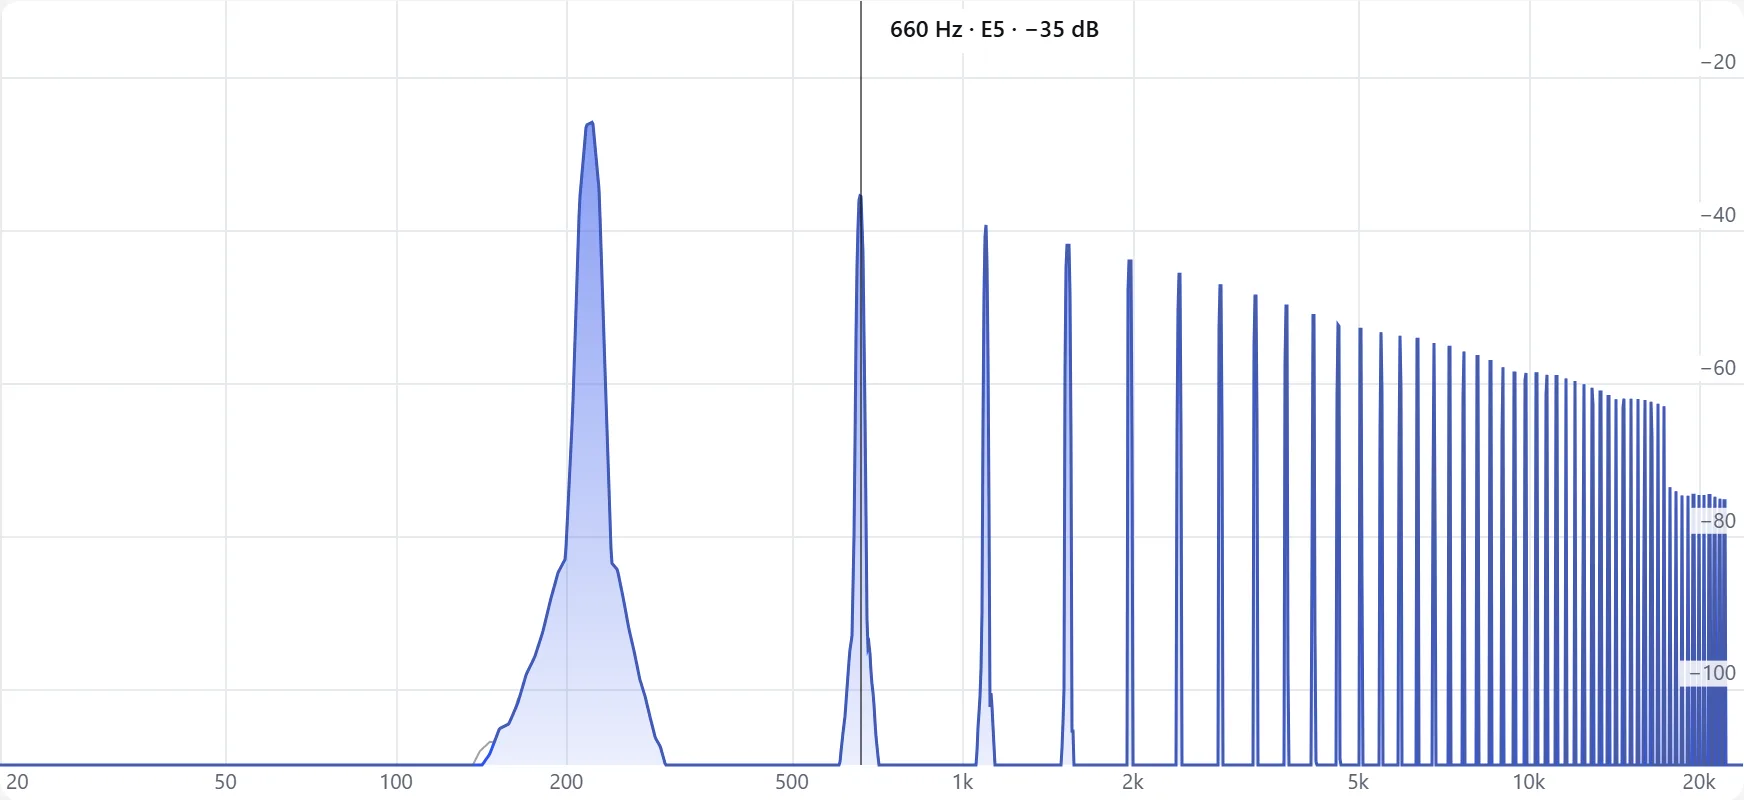
A pure tone shows as a single sharp spike. Real instruments and voices show a fundamental (the note you hear) plus a series of harmonics at 2×, 3×, 4× that frequency. The pattern of harmonics is what makes a piano sound different from a flute. Try it: run the microphone, play these 220 Hz tones through your speakers, and watch the spectrum.
How to read a spectrogram
The spectrogram shows the last several seconds as an image. Time moves from right to left, frequency rises from bottom to top, and color shows level, from black (silent) through purple and orange to pale yellow (loudest). It reveals things a spectrum can’t:
- Steady horizontal lines are constant tones such as hum, a whine, or a fan’s blade frequency.
- Stacked, parallel lines that move together are a voice or instrument: the fundamental and its harmonics.
- Vertical streaks are short broadband sounds such as clicks, claps and consonants like “t” and “s”.
- A flat ceiling across all sounds shows the bandwidth limit of the microphone, Bluetooth link or compressed file.
Play a frequency sweep and watch it draw a rising curve:
What each frequency range sounds like
| Range | Frequencies | What lives there |
|---|---|---|
| Sub-bass | 20–60 Hz | Rumble you feel more than hear: kick drum weight, pipe organ, mains hum (50/60 Hz) |
| Bass | 60–250 Hz | Bass guitar, the fundamental of male voices (85–180 Hz), boominess |
| Low mids | 250–500 Hz | Body and warmth. Too much sounds muddy or boxy |
| Mids | 500 Hz–2 kHz | Most instruments’ fundamentals, the “honk” of a telephone |
| Upper mids | 2–4 kHz | Speech clarity. The ear is most sensitive here, so feedback often starts here |
| Presence | 4–6 kHz | Definition and closeness of voices and instruments |
| Brilliance | 6–20 kHz | “S” sounds, cymbals, air and sparkle. The first range lost with age |
Practical uses
- Find hum and noise. A sharp peak at 50 or 60 Hz with its harmonics is electrical hum. A broad hump around 100–300 Hz is usually a fan or HVAC system. A whine at a single high frequency is often a charger or coil.
- Stop feedback. When a PA system or a mic near a speaker starts to ring, one frequency shoots up. Read it here, then cut that frequency with a narrow EQ notch.
- Check a microphone. Speak and see how much high-frequency detail it captures, and how loud its background noise is. Pair this with the mic test.
- Tune and identify notes. The peak readout shows the note and how many cents sharp or flat it is.
- Check your speakers and room. Play white noise from the noise generator and capture it with a microphone: an ideal system would show a flat line. Dips and bumps show your speakers’ and room’s coloration, especially in the bass.
- Spot fake lossless audio. Open a FLAC or WAV file and look at the spectrogram. If everything stops sharply at 16 kHz, it was made from a low-bitrate MP3.
FFT size and settings
The analyzer uses a Fast Fourier Transform (FFT) to split the audio into frequency bands. A bigger FFT gives narrower bands (finer frequency detail), but each analysis covers a longer slice of time, so it reacts more slowly. At a 48 kHz sample rate:
| FFT size | Frequency resolution | Time window | Best for |
|---|---|---|---|
| 2048 | 23.4 Hz | 43 ms | Fast-changing sounds, speech |
| 4096 | 11.7 Hz | 85 ms | General use |
| 8192 | 5.9 Hz | 171 ms | Music, default |
| 16384 | 2.9 Hz | 341 ms | Bass detail, room modes |
| 32768 | 1.5 Hz | 683 ms | Separating close tones, hum harmonics |
Smoothing averages each frame with the previous ones. Higher values give a calmer, easier-to-read curve, and lower values show every flicker. Range sets the quietest level shown. Lower it to see faint detail, or raise it to hide the noise floor.
Capturing audio from a browser tab
- Click Tab or screen audio.
- In the sharing dialog, choose the Chrome Tab (or Edge Tab) section and pick the tab that’s playing audio.
- Make sure Also share tab audio is switched on, then click Share.
- To stop, click Stop sharing in the browser bar or Stop here.
On Windows you can also share an entire screen with Share system audio turned on, which captures everything your computer plays, including desktop apps.